The Inventory Weeks On Hand Report provides an estimation of the quantity and value of inventory currently on hand in the restaurant. The Inventory Weeks On Hand report also estimates each individual inventory item’s weekly use and how many weeks each individual inventory item might last. This report is a great tool when identifying ordering behaviors such as over-purchased product that may need to be transferred to another store to be used before the product expires.
Answer questions such as:
- What inventory items will be on the shelves the longest?
- What stores are likely to run out of product before their next truck?
- For those stores carrying too much of a particular product, what stores would be good candidates for them to transfer product to?
The amount of product used since the last count is estimated based on weekly counting trends.
In order to utilize this report, your team must be using weekly countsheets.
Accessing Inventory Weeks On Hand
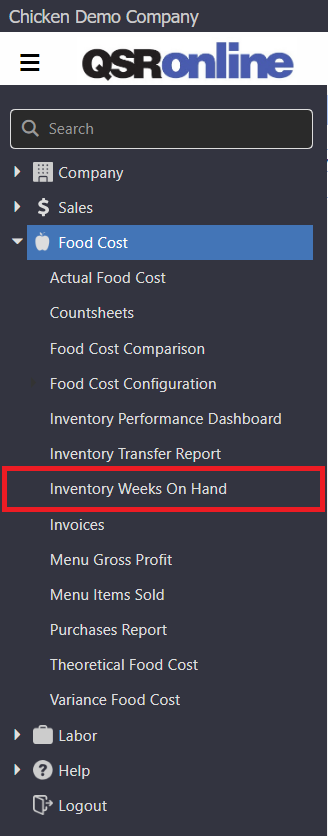
To access Inventory Weeks On Hand, select the Menu > Food Cost > Inventory Weeks On Hand.
Running Inventory Weeks On Hand
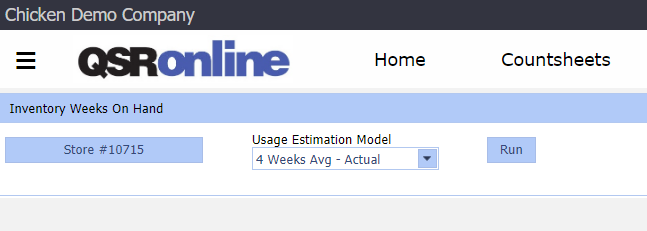
Choose your “Unit(s)” and “Usage Estimation Model”. Then click “Run” to populate the report. There is no date selector since the nature of the report is to estimate inventory on hand in your stores as of the start of the current business day.
The “Usage Estimation Model” is how this report calculates the amount of product used since the last saved weekly count.
In order to utilize this report, your team must be using weekly countsheets.
Usage Estimation Model
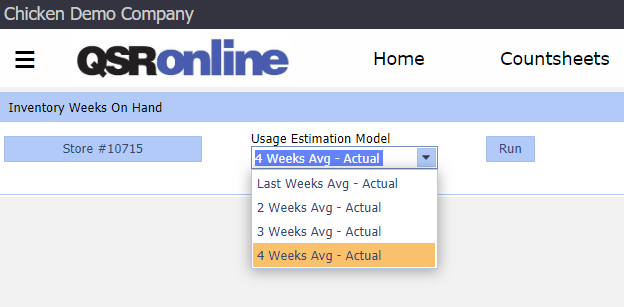
The Inventory Weeks On Hand Report uses the “Usage Estimation Model” to estimate how much product has been used since the latest weekly count. This is achieved by calculating the average “Actual Food Cost Usage” for either the last week, the last 2 weeks, the last 3 weeks or the last 4 weeks. Once the “Actual Food Cost Usage” is calculated, the average product usage is then distributed based on the average percentage of sales for each day of the week. You will choose how many weeks to include when selecting your “Usage Estimation Model” before running the report. If you are just beginning a new season or recently added a new product, then it may be best to select “Last Week Avg – Actual.” If you are well into seasonality and your menu is fairly static, then it may be best to select “Last 4 Week Avg – Actual.”
The method of calculating estimated product usage is best explained through an example. We will use Olive Oil. In this example, today is Wednesday. We save weekly countsheets for Mondays (count completed Sunday night after close or Monday morning before open). And we have selected “Last 4 Week Avg – Actual” for our “Usage Estimation Model”.
First we calculate average Actual Food Cost Usage:
4 weeks ago, the actual weekly usage for Olive Oil was 4 cases.
3 weeks ago, the actual weekly usage for Olive Oil was 5 cases.
2 weeks ago, the actual weekly usage for Olive Oil was 3 cases.
Last week, the actual weekly usage for Olive Oil was 5 cases.
So the 4-week Average Olive Oil Used Per Week is 4.25 cases.
Let’s say, over the last 4 weeks, the average percentage of Weekly Net Sales of Olive Oil for each day of the week has been:
Sunday: 14%
Monday: 9%
Tuesday: 11%
Wednesday: 11%
Thursday: 16%
Friday: 18%
Saturday: 21%
Since today is Wednesday, the Inventory Weeks On Hand Report is estimating product on hand as of close of business Tuesday. It is not taking into consideration any sales or usage from today (Wednesday).
On this store’s latest weekly countsheet saved for Monday, the store counted 6.5 cases of Olive Oil. When calculating the estimated Olive Oil usage since our last count, we need to account for Monday and Tuesday’s usage. For the last 4 weeks, Monday has been averaging 9% of this store’s total Weekly Net Sales and Tuesday has been averaging 11%, so altogether we estimate that roughly 20% of this week’s Net Sales have occurred. Therefore we estimate 20% of the 4 week average usage of Olive Oil has been used for the week by Wednesday morning before business opened. 20% of 4.25 cases is 0.85 cases of Olive Oil used so far this week. Since 6.5 cases were on hand Monday, we estimate the store now has 5.65 Olive Oil cases on hand now.
This calculation is being used for every inventory item on the last weekly countsheet.
Inventory Weeks On Hand Report Options
The Inventory Weeks On Hand Report provides end users a variety of ways to format, filter, sort and search information. Once you have configured a layout that suits your needs, save the layout for quick loading in the future. This is achieved by saving information to your browser’s cache.
Please note: Clearing your cache will clear your saved layout.
- Pivot Table: For those users accustomed to Pivot Tables, use the “Field Chooser” to filter what information displays as well as configure columns, rows, and mathematics functions.
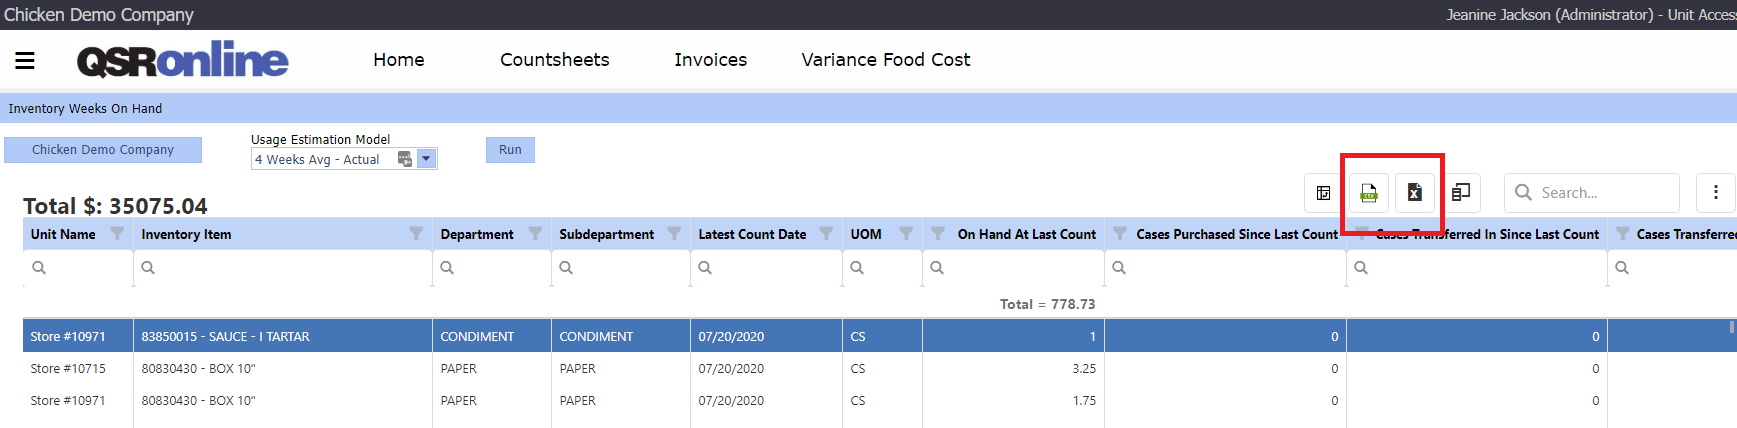
- Export to .CSV: Exports all raw data generate by the report (excluding filters or groupings) into a .CSV file format.
- Export Microsoft Excel 2003 – 2007 (.XLS): Exports the report as it is currently formatted (including filters and groupings) into an .XLSX file format.
- Column Chooser: Allows you to add/remove columns from the grid by selecting the “Column Header” and dragging the columns from/to the “Column Chooser”.
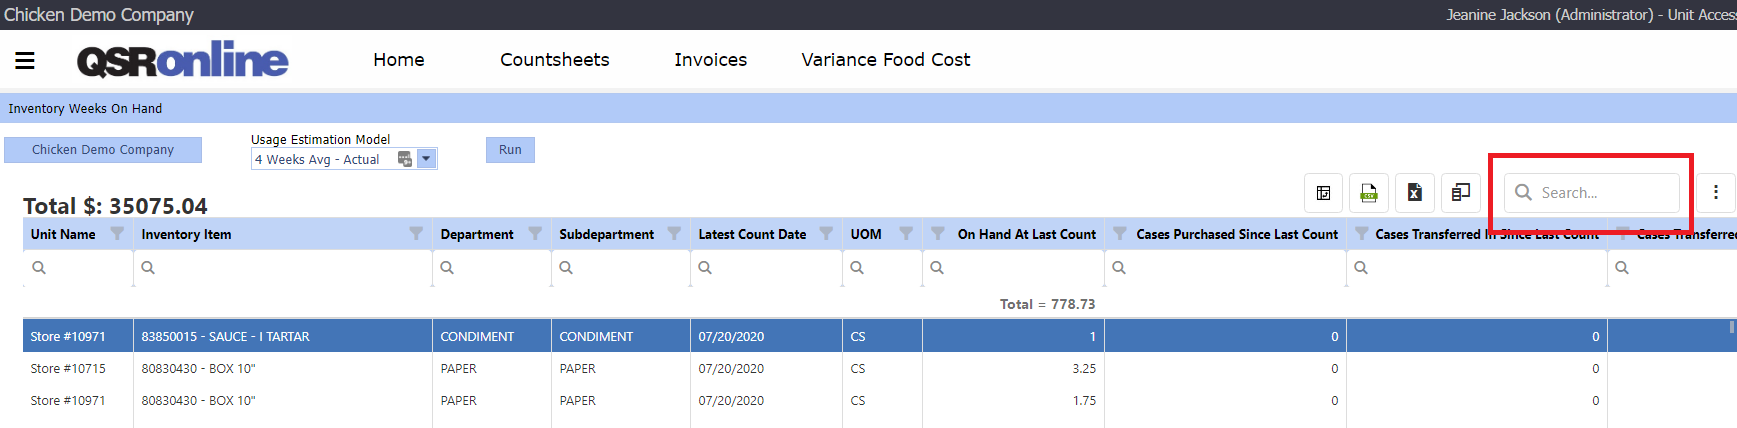
- Search: Allows you to filter the data by column using specific keywords and/or parameters.
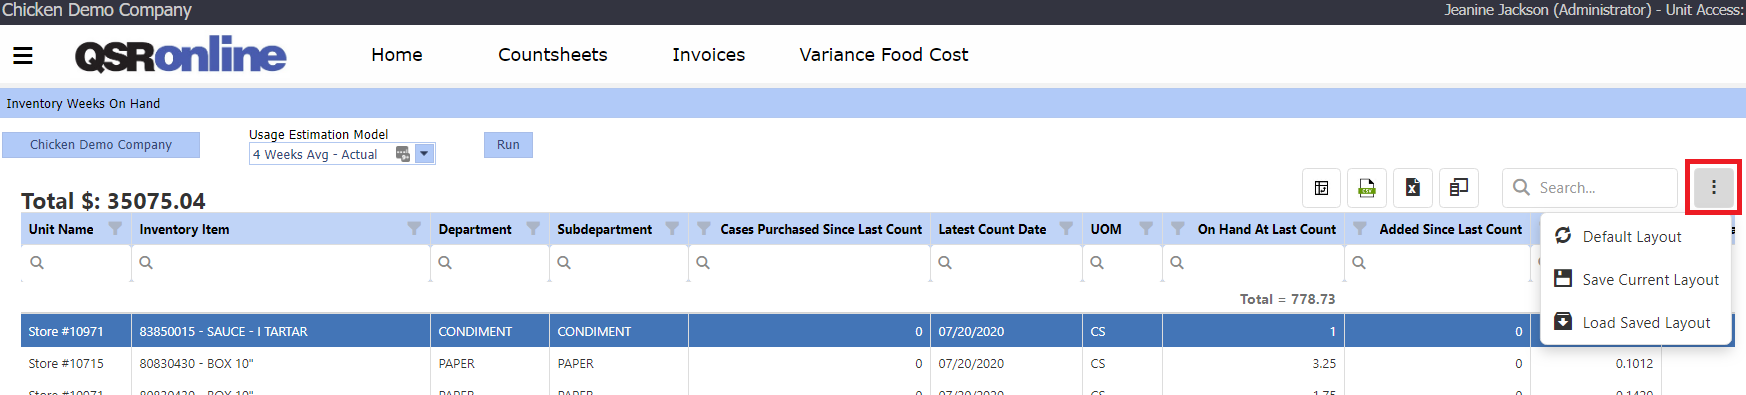
- Vertical Ellipses Menu: “Clear”, “save’ or “Load” a layout.
- Default Layout: Clear all selected formatting, filters and sorting options.
- Save Current Layout: Saves your custom report layout.
- Load Saved Layout: Each time you login, the Inventory Dashboard will reflect your saved layout.
- Column Headers: Right click a column header to view the following options.
- Sort Ascending
- Sort Descending
- Clear Sorting
- Group by this column
- Ungroup All
- Freeze Column (To the Left or To the Right)
- Unfreeze Column
- Column Header Filter: select all or specific values to display.
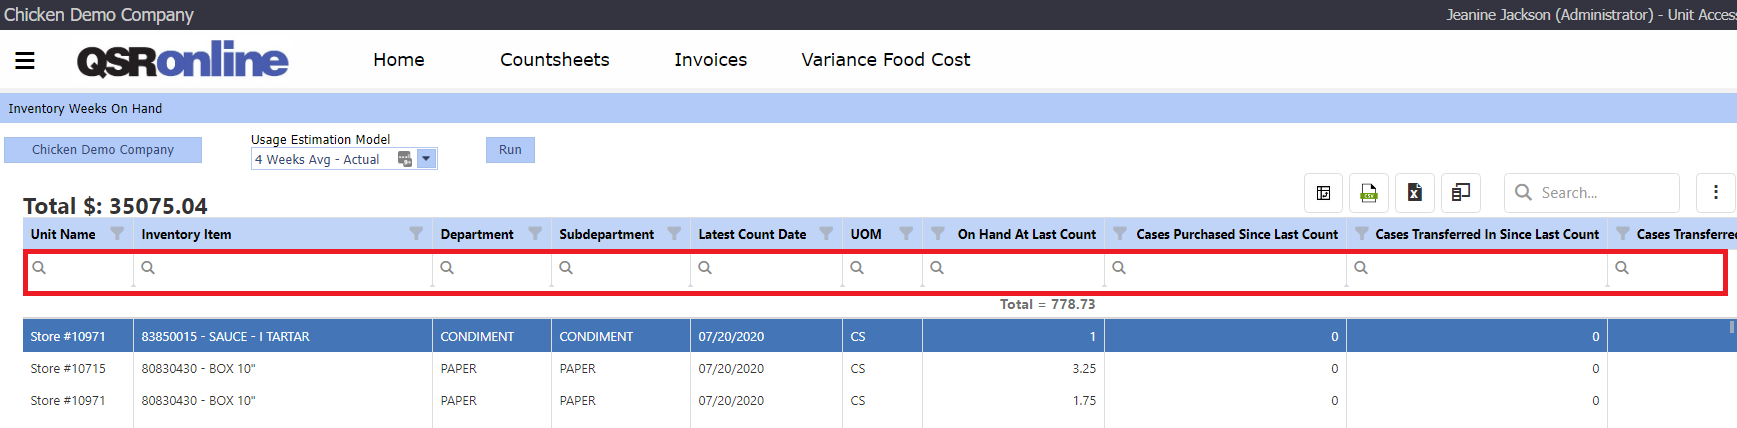
- Column Specific Search: type in the first row to search that specific column by a keyword. Click the magnifying glass in the column specific search to select from an assortment of options.
Customizing Inventory Weeks On Hand
You can customize which columns display within the Data Table by simply dragging them to/from the Column Chooser to remove/add.
After you have customized which columns to display within the Data Table, drag and drop columns in the order you want them to appear.
Group the columns based on how you wish to organize data. Common columns to group by include Unit Name, Department, Sub-Department and Inventory Items.
If all selected columns do not fit on your screen, freeze a column to the left or right for easy reference when scrolling laterally.
At this point you may choose to sort or use a column search/filter option to narrow down the Data Table to help answer more focused questions such as:
- What inventory items will be on the shelves the longest?
- What stores are likely to run out of product before their next truck?
- For those stores carrying too much of a particular product, what stores would be good candidates for them to transfer product to?
After you have customized the Inventory Weeks On Hand report to your liking, go to the vertical ellipses and select “Save Current Layout.” The next time you log in, go to the vertical ellipses and select “Load Saved Layout”. Upon doing so, your saved layout will load.